Transcriptomics
Transcriptomics is essentially the study of the transcriptome. Every complete set of RNA fragment transcribed from DNA in any organism is part of their transcriptome. The comparison among transcriptomes allows further understanding of differentially expressed genes throughout different cell populations [1].
Transcriptomics is essentially the study of the transcriptome. Every complete set of RNA fragment transcribed from DNA in any organism is part of their transcriptome. The comparison among transcriptomes allows further understanding of differentially expressed genes throughout different cell populations [1].
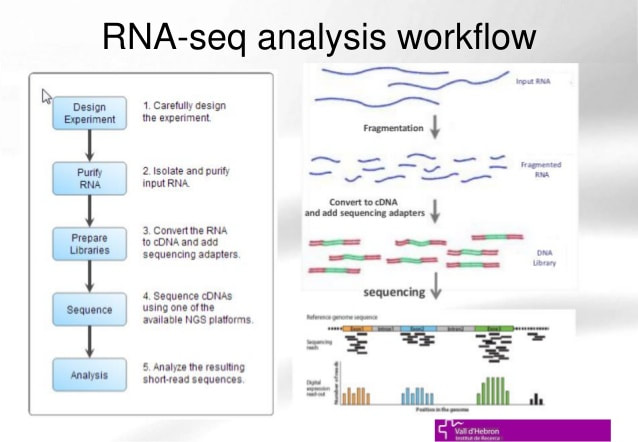
Figure [A] shows the precedures taken in an RNA Sequence Data analysis starting from an RNA segment, reverse trancribed back to a cDNA where they're constructed into a cDNA library for future expression analysis in-vivo through a host organism [4].
|
Why Use Transcriptomics?
Analysing the sets of RNA transcripts produced by the gene allows for identifying the expression levels if different genes and whether or not they’re on or off in a given cell line through the use of high throughput methods such as microarray analysis. By studying where RNA transcripts are found in different tissues, it can help uncover clues of what the function of an newly discovered and previously unknown gene [3].This body of knowledge plays a huge role in deciding how to target genetic defects and better provide specific therapies and medicine to eliminate disease. |
|
GEO Profiles
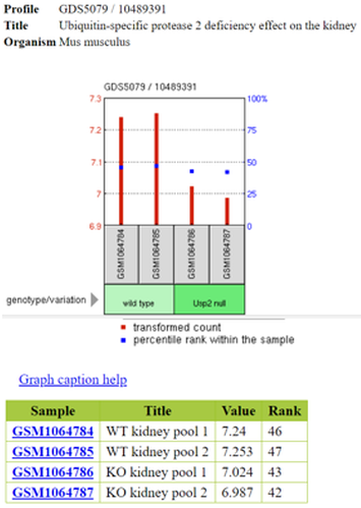
These profiles as seen on Figure B (right) show the expression levels of Ubiquitin-specific protease 2 samples in the assay. The profile of Ubiquitin-specific-protease 2 deficiency on kidneys in mus muscula has an internal link with ADA. |
|
GEO Dataset
The gene expression omnibus dataset stores advanced data display of gene expression levels shown through heatmaps to demonstrate high or low expression various genes involved in a particular disease. GEO uses different clustering methods such as uncentered, pearson correlation, or euclidean with different algorithm options such as unweighted pair group method with arithmetic mean, single linkage, or complete linkage [3].
The gene expression omnibus dataset stores advanced data display of gene expression levels shown through heatmaps to demonstrate high or low expression various genes involved in a particular disease. GEO uses different clustering methods such as uncentered, pearson correlation, or euclidean with different algorithm options such as unweighted pair group method with arithmetic mean, single linkage, or complete linkage [3].
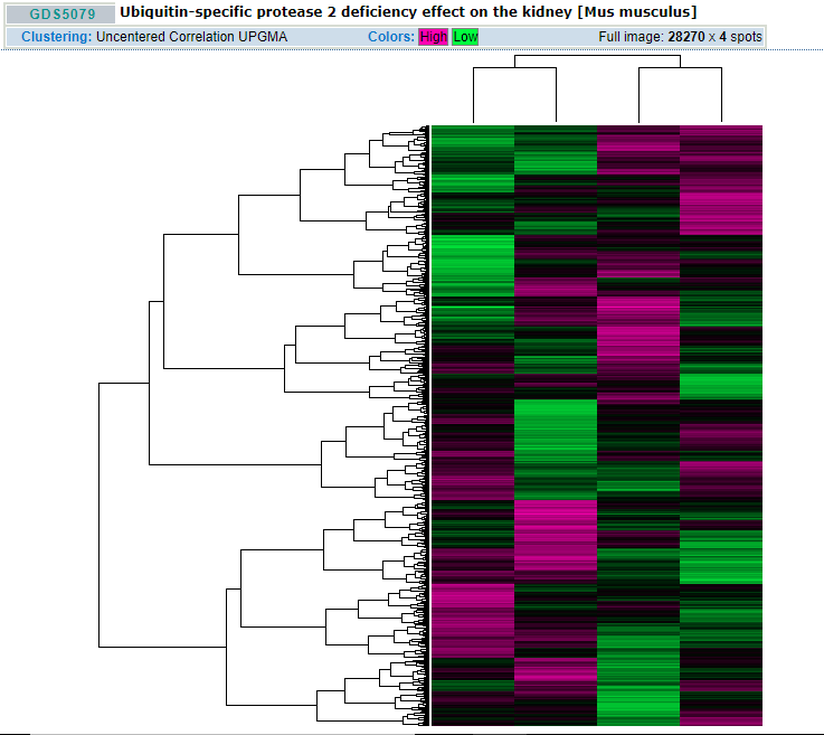
Figure C. shows a heatmap of all the genes involved in the Usp2 deffeciency effect in the Kidneys with purple showing high expression and green showing low expression [3].
Resources
[2][IMAGE]http://ib.bioninja.com.au/standard-level/topic-2-molecular-biology/27-dna-replication-transcri/central-dogma.html
[1] Transcriptomics https://www.nature.com/subjects/transcriptomics
[3] Transcriptome https://www.genome.gov/13014330/
[4] Introduction to RNA-seq and RNA-seq Data Analysis (UEB-UAT Bioinformatics Course - Session 4.1 - VHIR, Barcelona) Course: Bioinformatics for Biomedical Research (2014). Session: 4.1- Jun 12, 2014
[5] About GEO Profiles https://www.ncbi.nlm.nih.gov/geo/info/profiles.html July 26th 2016
[6] Ada - Ubiquitin-specific protease 2 deficiency effect on the kidney https://www.ncbi.nlm.nih.gov/geoprofiles/111875353
